Introducing the PagerDuty Common Event Format
Since its inception, PagerDuty has become the standard for IT Operations alerting. As our list of partner integrations and customers has grown, the volume of IT Operations event data ingested by PagerDuty has likewise increased. We are continually exploring various methods in which we can improve incident response (and overall incident management) using this fascinating data set.
One method in particular, event and alert correlation (the aggregation of individual events and alerts into relevant incidents), shows promise in optimizing IT Operations. By correlating events and alerts into incidents, noise is reduced and root cause analysis enhanced. Until very recently, the alert data sent to PagerDuty was mapped from each integration’s original format into an unstructured blob which encompassed the relevant event details. While this mechanism and event format is viable for notifications (we forward on whatever the details we are sent), it isn’t the best format for event classification and correlation.
A New Way to View Event Data
Recognizing that a new, better way had to be developed to meet the needs of our customers, we created a new event format — the PagerDuty Common Event Format (PD-CEF). PD-CEF is a structured event format that is integration agnostic, allowing PagerDuty to provide powerful new capabilities.
When events from all of your IT Operations management and monitoring tools are normalized into a common format, the ability to correlate events and to create policies encompassing events from multiple sources becomes possible. More normalized events from multiple systems equals better and broader situational awareness into the status of your IT infrastructure. Enhanced situational awareness has a direct impact on improving critical metrics such as Mean Time To Repair (MTTR).
PD-CEF is the new way for you to view your event data, and we’re delivering it to you in the PagerDuty UI today. We’ve enabled PD-CEF for AWS CloudWatch , Splunk Webhook, Datadog, Sensu, and Nagios – and more integrations are on the way.
Seeing all of your alerts from different vendor sources in the same format is a powerful means of achieving better situational awareness.
An example of PD-CEF can help an organization that may be running the AWS CloudWatch and Datadog integration is as follows:
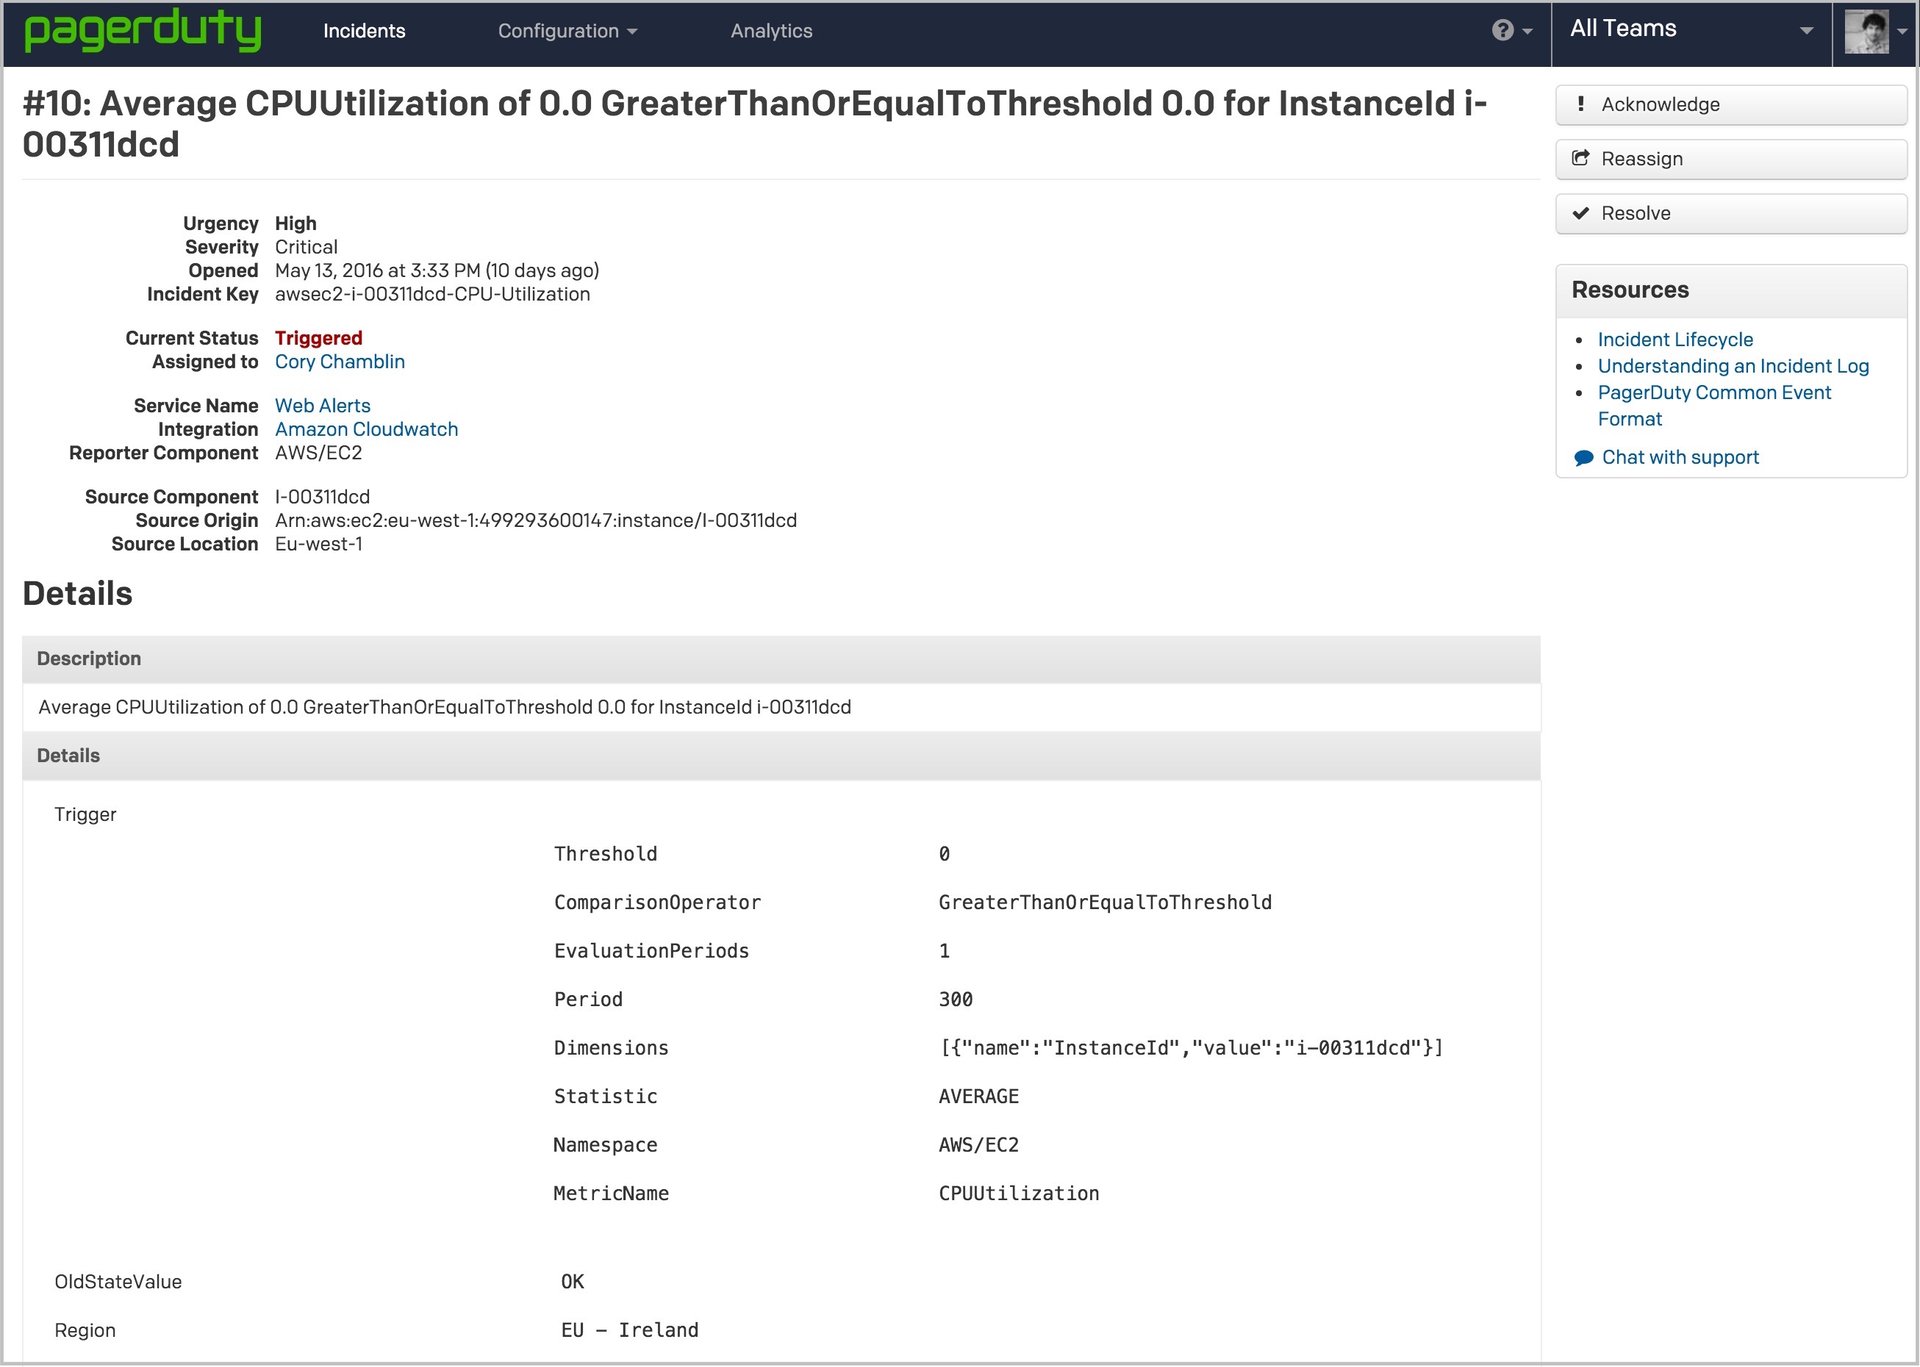
- AWS Cloudwatch events have fields like: Trigger, OldStateValue, NewStateValue, NewStateReason, Region, StateChangeTime, AlarmName, AlarmDescription.
- Datadog has its own format with fields such as body, priority, query, event_type, title, event_id, org, and tags.
When an incident occurs and alarms relating to the incident are generated by these two monitoring systems, a significant amount of time is spent deciphering the various event formats. With PD-CEF, all events — regardless of the vendor source — are normalized to the same format; easing the cognitive load on the on-call engineers and allowing them to troubleshoot faster than ever before.
We’re making a lot of investments and are looking forward to working with you on the future of efficient and scalable IT Operations.
PD-CEF is available for you today to streamline your IT Operations environment. Drop me a line and let me know what you think about PD-CEF.
Ophir Ronen
ophir@pagerduty.com