Start Using PagerDuty Today
Try PagerDuty free for 14 days — no credit card required.
Dynatrace automatically monitors your applications and services, analyzes problems, and notifies you when something goes wrong. Dynatrace learns your entire application architecture automatically, it intelligently chooses the right visualization for you so you can easily make sense of your data and environment. Tailor-made infographics communicate the most important facts about all aspects of your application environment.
There are two ways to integrate PagerDuty with Dynatrace:
1. In your Dynatrace account, click the menu button on the top left of the page.

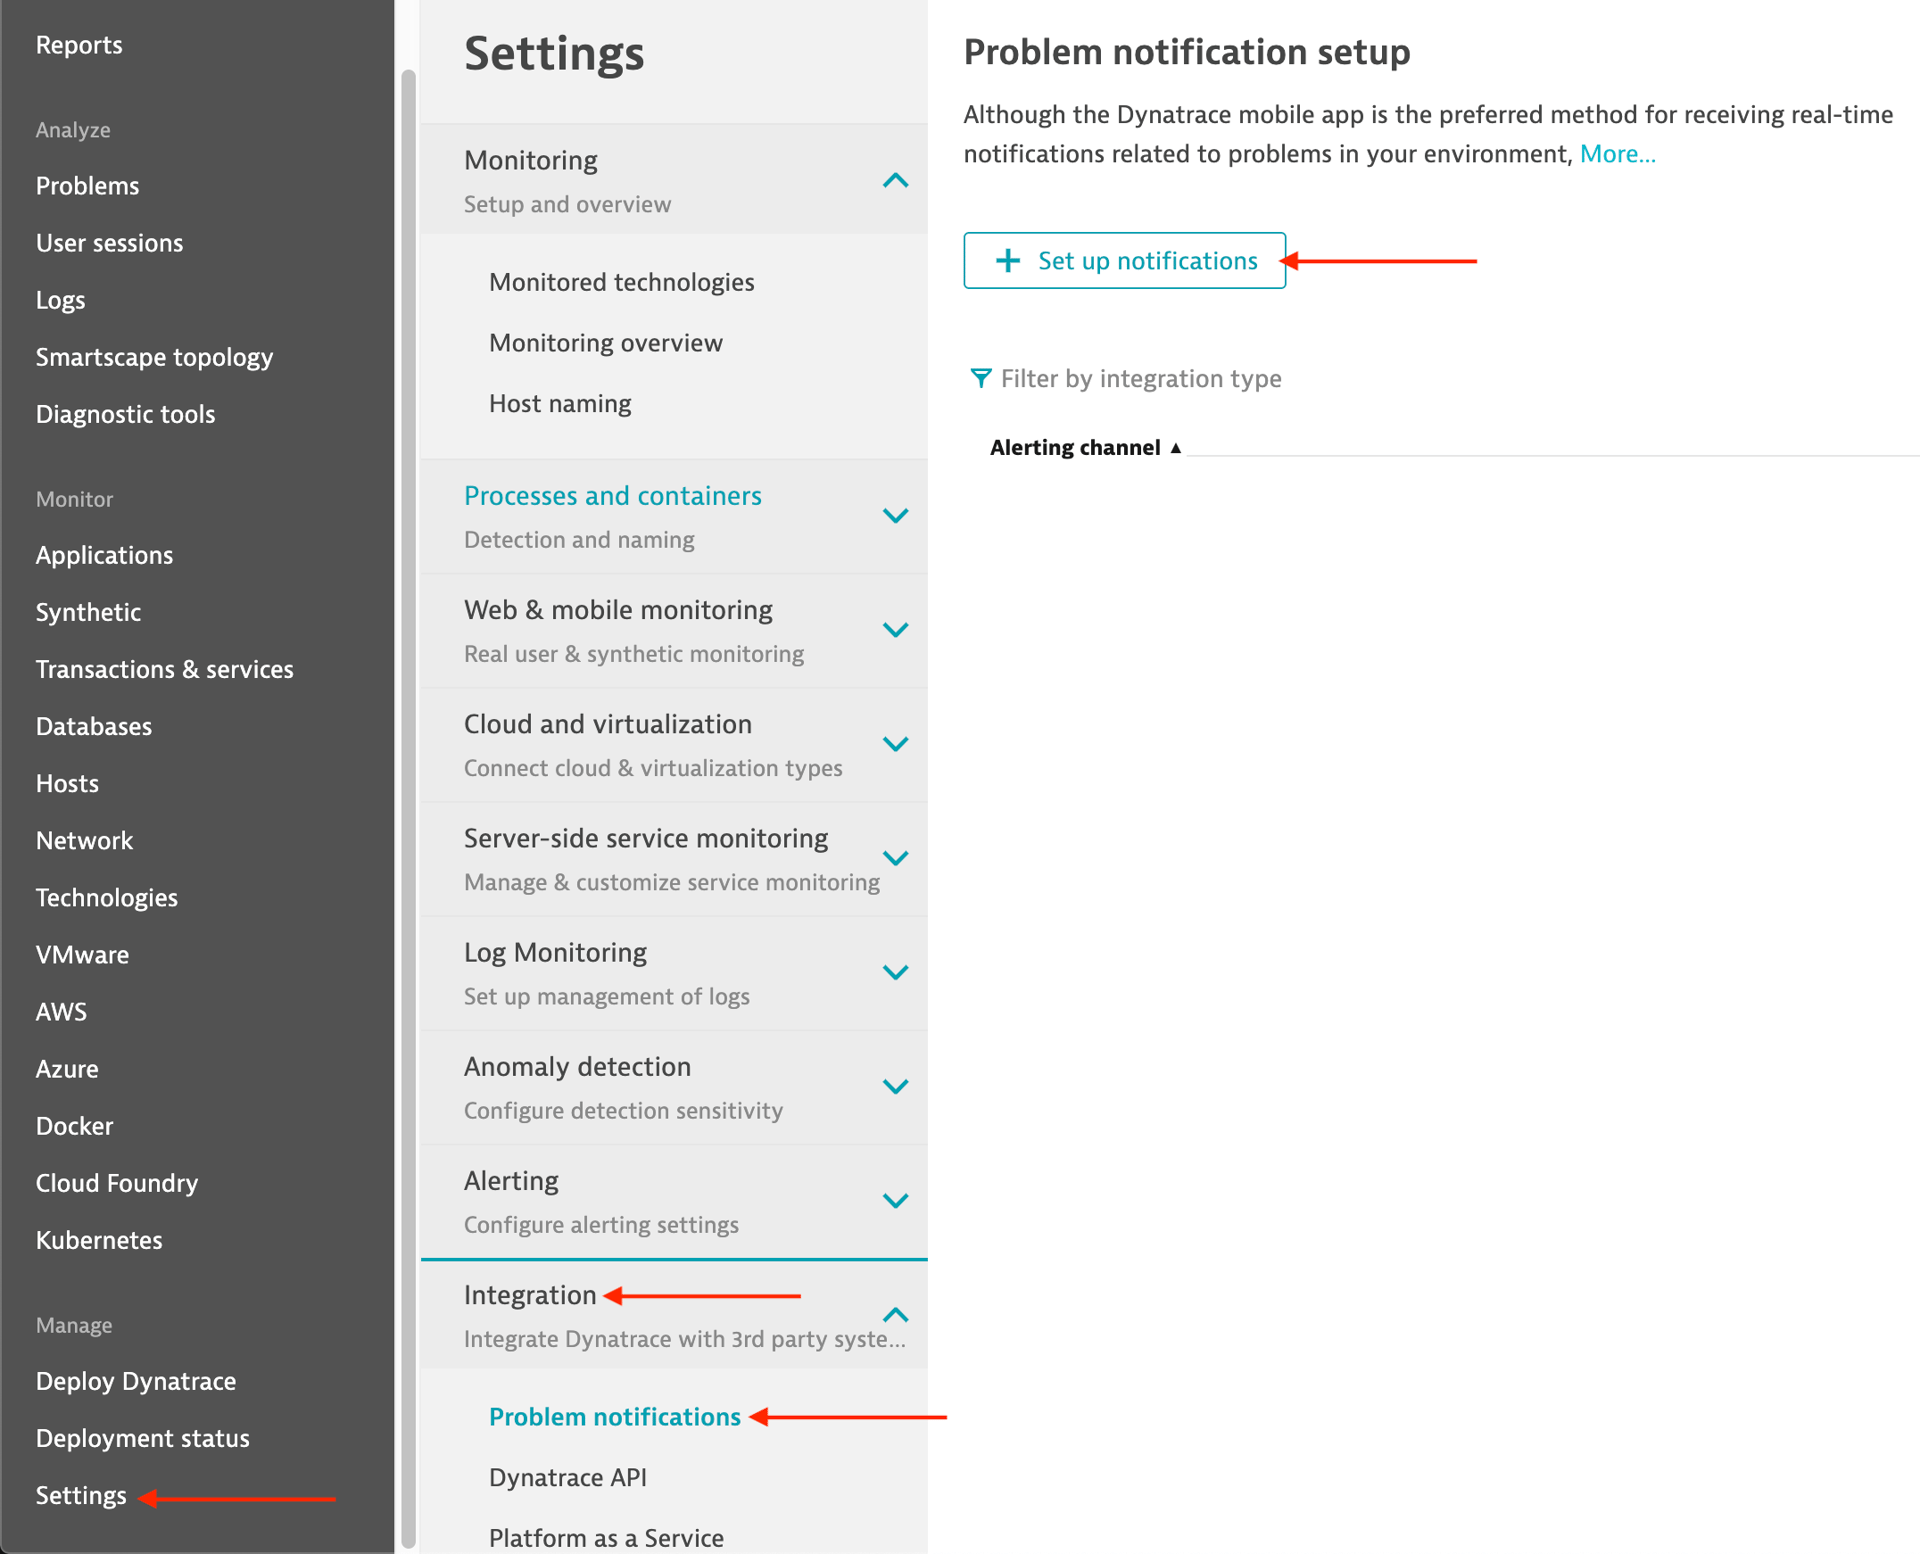
2. Select Settings → Integration → Problem Notifications → Set up notifications.
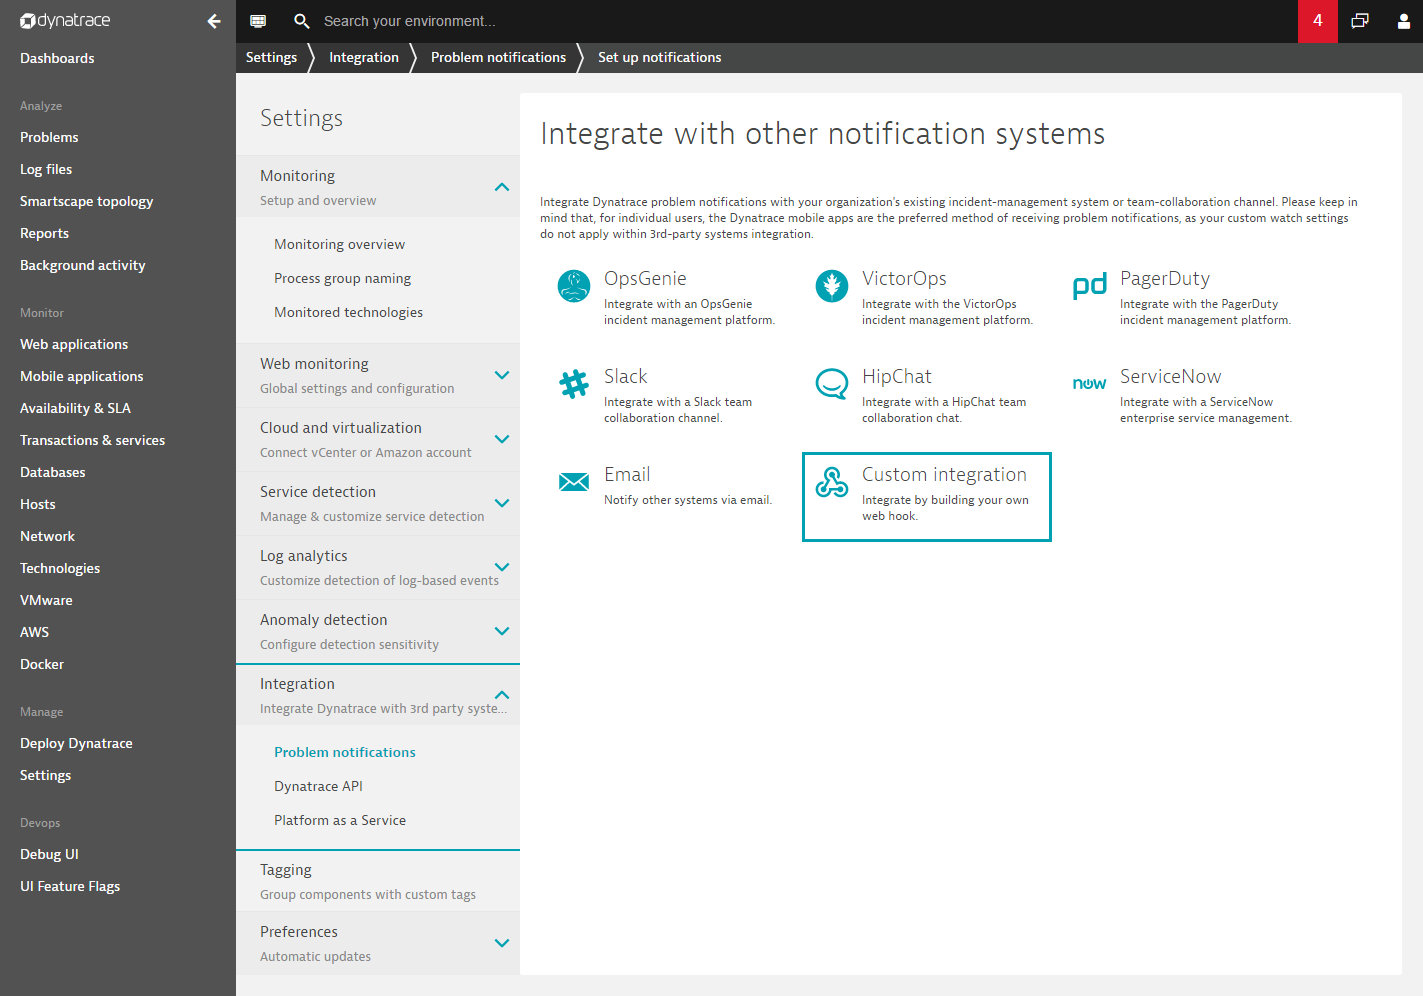
3. Select PagerDuty as the notification method and click the Alert with PagerDuty button.
4. You will be redirected to PagerDuty, and asked to authorize the integration by entering your PagerDuty login credentials or by authenticating with your SSO provider.
5. Next, you’ll be asked to create a new PagerDuty service or to select an existing one. Dynatrace will use this service to trigger new incidents in PagerDuty.
6. Next you’ll be redirected back to Dynatrace and you will see the integration details. You may optionally add an Alerting Profile at this step. Next, click Send test notification.
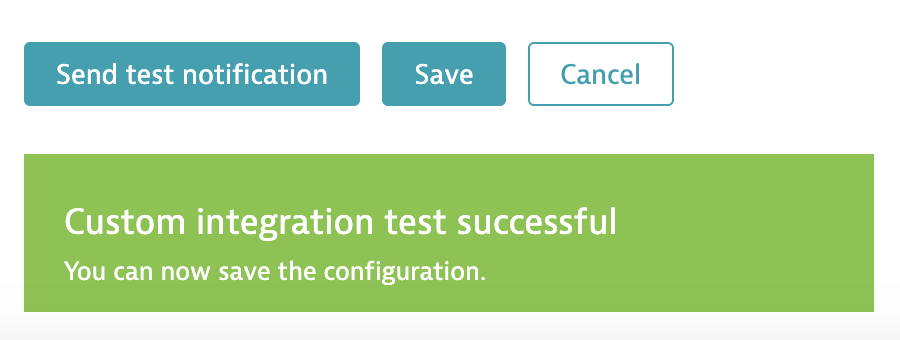
7. You should see a dialog noting that the integration was successful, with a corresponding test incident triggered in PagerDuty. Click Save to complete the integration. Your new notification method will show next to any other methods you’ve added.
1. In Dynatrace, navigate to Settings → Integration → Problem notifications.
2. Click Set up notifications, and select Custom integration.
3. On the Set up custom integration screen, enter a Name for your integration, in the Webhook URL field, enter the generic PagerDuty Events URL https://events.pagerduty.com/v2/enqueue and input the following in the Custom payload field. In the routing_key field, enter an Integration Key for a generic Events API integration, or enter a global event routing Integration Key:
{
"dedup_key": "{PID}",
"event_action": "trigger",
"routing_key" : "YOUR_INTEGRATION_KEY",
"payload": {


"summary": "{ProblemTitle}",
"source": "{ImpactedEntity}",
"severity": "critical",
"client": "dynatrace",
"client_url": "{ProblemURL}",


"custom_details": {
"incident_key": "{PID}",
"hostname": "{ImpactedEntity}",
"event_storage_id": "{ImpactedEntity}",
"State": "{State}",
"ProblemTitle": "{ProblemTitle}",
"Problem Details HTML": "{ProblemDetailsHTML}",
"Problem Details JSON": {ProblemDetailsJSON},
"ProblemID": "{ProblemID}",
"Impact": "{ProblemImpact}"

        }
    }
}
4. Click Send test notification and you should receive a “Custom integration test successful” dialog. Click Save to complete the integration.
Yes! You would simply repeat all the steps above to create a new service to use with Dynatrace, or you can opt to create a webhook integration and use a global event routing integration key (instructions above).
If you are creating an integration on a PagerDuty service, Dynatrace will resolve incidents once the issue has been resolved.
If you are creating an integration with a custom webhook, you will need to use event rules to interpret the “status” field in the custom_details. Using a custom webhook integration on its own will not work because the custom webhook isn’t sending the actual “status” (opened or closed) and it will always be interpreted as an alert.
Please contact our support team if you need any assistance with the integration.
Try PagerDuty free for 14 days — no credit card required.