- PagerDuty /
- Integrations /
- Pandora FMS Integration Guide
Pandora FMS Integration Guide
Pandora FMS makes monitoring visual. It displays the status and performance of parameters from different operating systems, servers, applications and hardware systems, such as firewalls and routers. The output of your monitoring can also be used in reports and alerts. With Pandora FMS' alert system, you can configure a near-infinite number of alerts and triggering behaviors for your users. An alert can send an email, SMS, trigger a sound alert, write a log, or do anything a custom script can do. In combination with PagerDuty, you can delegate notification tasks without having to configure and maintain those parts of your systems.
This integration allows you to convert Pandora FMS alerts into PagerDuty incidents. Pandora FMS alerts execute a Perl script to create PagerDuty incidents through API calls. Users can configure their service to manage their PagerDuty incidents in the normal way, through email, SMS, phone calls or mobile push notifications.
Requirements
Pandora FMS 5.0 or higher must be installed. For a full list of the requirements, please see the online documentation at: https://wiki.pandorafms.com. Perl will also need to be installed with the following dependences:
- LWP::UserAgent (To perform the Post call to the API)
- JSON (To build the data structure on the call)
- File::Basename (To find the script path and store the temporary files)
- IO::Socket::SSL (To perform the API call using HTTPS)
As the integration will be performed by calling to PagerDuty's API, you'll also need an Internet connection.Since Pandora FMS 5.0 SP3, the integration script and an alert command called 'PagerDuty incident' are included out-of-the-box.If the steps below have been completed, you may skip steps 1 and 2 of the "In Pandora FMS" section of this guide:
- The integration script's path is: [SERVER_INSTALLATION_PATH]/pandora_server/util/pagerduty/pandorafmsalert2pagerduty.pl
- The Alert command list of your system is available in the section Administration > Manage alerts > Commands of your Pandora FMS console.
In PagerDuty
- From the Services menu, select Service Directory.
- On your Service Directory page:
If you are creating a new service for your integration, click +Add New Service.
If you are adding your integration to an existing service, click the name of the service you want to add the integration to. Then click the Integrations tab and click the Add a New Integration link. - Select your app from the Integration Type menu and enter an Integration Name.If you are creating a new service for your integration, in General Settings, enter a Name for your new service. Then, in Incident Settings, specify the Escalation Policy, Notification Urgency, and Incident Behavior for your new service.
- Click the Add Service or Add Integration button to save your new integration. You will be redirected to the Integrations page for your service.
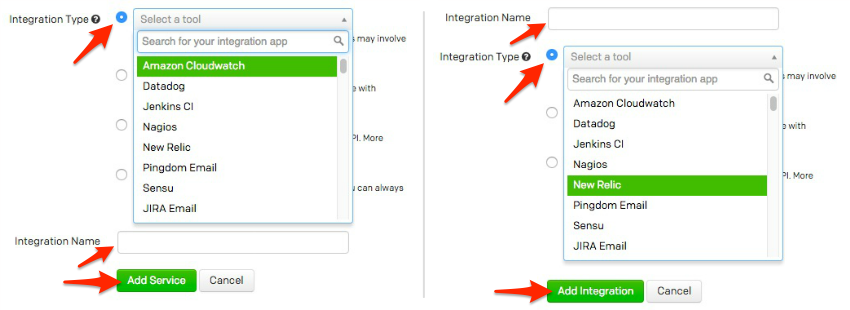
- Copy the Integration Key for your new integration:

In Pandora FMS
- Download the script called pandorafmsalert2pagerduty.pl from the Pandora FMS modules library.
- Place it in a path reachable by the server. The recommended path is:
[SERVER_INSTALLATION_PATH]/pandora_server/util/pagerduty/ - Create an “Alert Command” for the generic execution of the script. This can be done in two ways: automatically with a predefined SQL script or manually through the Pandora FMS interface.
- AutomaticallyExecute on your Pandora FMS (5 or greater) database the SQL script PagerDutyPandoraFMSCommand.sql. You can find this script in the
Pandora FMS modules library. - ManuallyGo to menu Administration > Manage alerts > Commands and create an alert command with the call to the script that will be executed when the alert is fired:
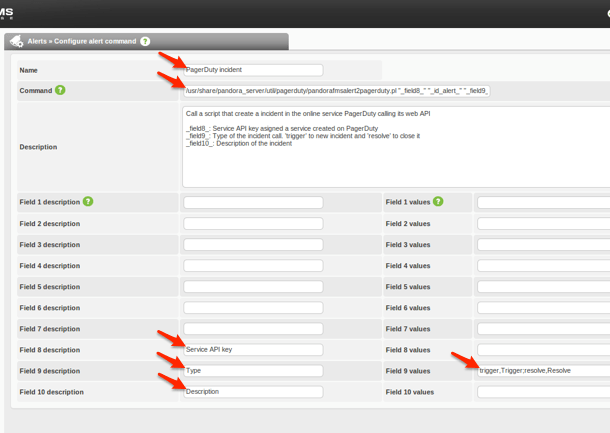 The command is the call to the integration script using the absolute path:
/usr/share/pandora_server/util/pagerduty/pandorafmsalert2pagerduty.pl "_field8_" "_id_alert_" "_field9_" "_field10_" "_timestamp_" "_alert_text_severity_" "_agent_" "_module_" "_data_"The custom fields will be:
- _field8_: Service API key retrieved from your PagerDuty service
- _field9_: Type of the incident. Possible values:
- trigger: For standard calls to create or update incidents.
- resolve: To close incidents. _field10_: Description of the Incident.
NOTE: Higher fields are preferred for compatibility with typical templates and actions, which use lower fields.
- AutomaticallyExecute on your Pandora FMS (5 or greater) database the SQL script PagerDutyPandoraFMSCommand.sql. You can find this script in the
- Create an Alert Action for each PagerDuty service. An alert in Pandora FMS can have several actions; the actions use generic commands and add desired parameters. In this case, we create an action for each PagerDuty service. To do this, we go to menu Administration > Manage alerts > Actions and create a new alert action.
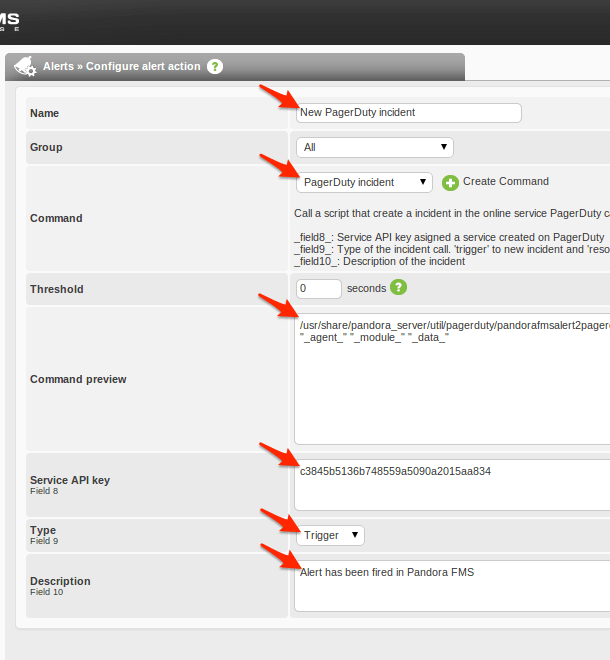 In the alert configuration we will enter a name and select the PagerDuty command that we previously created. Three configuration fields will appear:
- Service API key: This is the key that we get from our PagerDuty service.
- Type: Use 'Trigger' to create a new incident or 'Resolve' to close it. Resolve will typically be used on recovery alert parameters.
- Description: Description that will be sent to the PagerDuty incident. A generic example would be “Alert has been fired in Pandora FMS”.
When we change the configuration fields, the command preview updates to show us the execution of the integration script.
- Configure an alert template to close PagerDuty incidents when an alert has recovered. This step is only required if you want that when a recovered alert on Pandora FMS to close the associated incident in PagerDuty. Go to Administration > Manage alerts > Templates to edit the desired template.We are going to configure one of the templates that Pandora FMS has configured by default:“Critical condition”. However, this configuration is compatible with any alert template.
 In the template editor, go to Step 3 > Recovery.
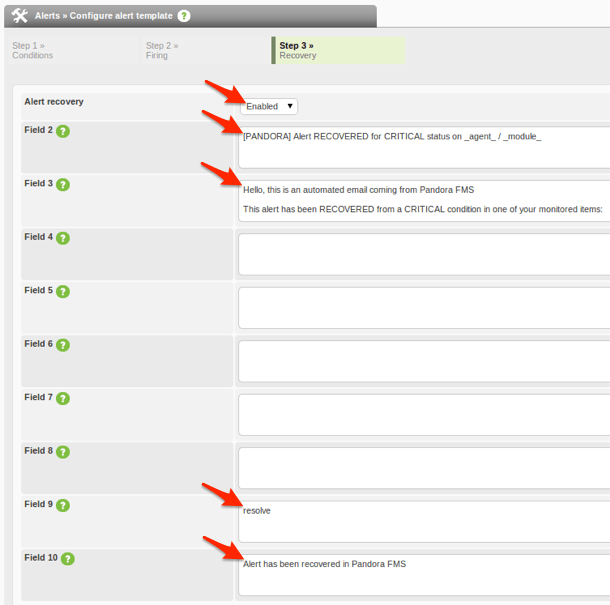
The fields configured on the command used to integrate with PagerDuty are 8,9 and 10.
- Field 8: PagerDuty service API key. This key is configured in the action and so is left blank.
- Field 9: Type of the incident. We selected Trigger in the action to create the PagerDuty incident when the Pandora FMS alert has been fired. Upon recovery we override the value with “resolve” to close the PagerDuty incident.
- Field 10: Description of the incident. We change the description to register a different description in the incident when it is closed. Another option is to leave the field blank and use the action field. In this case, the field will receive the prefix [RECOVER] when recovering. When the alert has recovered (example: the ping response works again), the incident on PagerDuty will be closed (Resolved).
- Congratulations! Your Pandora FMS system is now integrated with PagerDuty.
Verify Pandora FMS is Communicating with PagerDuty
- Create an example Agent in Administration > Manage monitoring > Manage agents by clicking on the Create agent button.
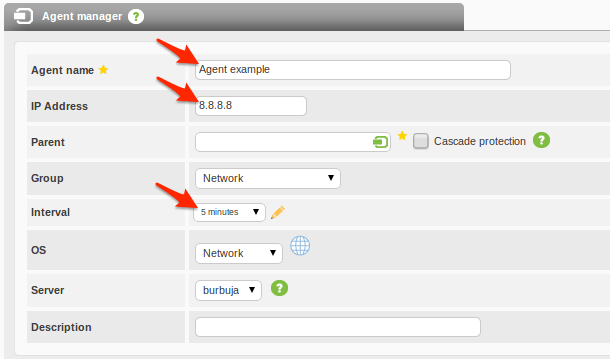
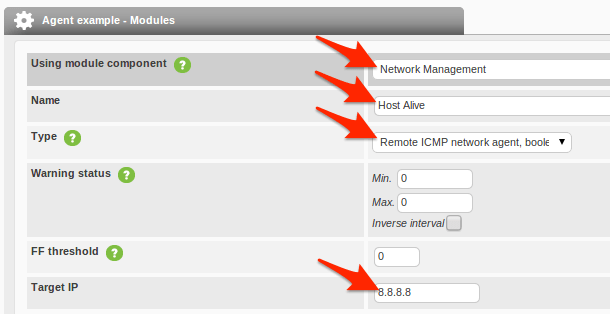
- Inside the agent, create a simple network monitor. Click on the Create a new network server module button.

- This monitor will be a 'Host alive' that will make a ping to a defined IP every 5 minutes. Click on the Create button once you have finished configuring the module.
- Associated with this module, we will create an alert with the template 'Critical condition' with the action 'New PageDuty incident'. Click on the Add Alert button when finished.
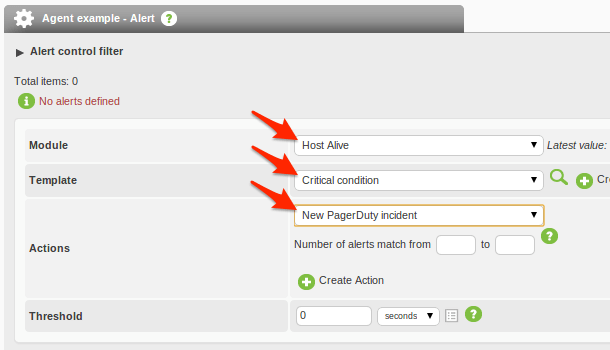
- Visually confirm the alert exists before it becomes critical.

- When this monitor goes to critical status (the ping fails), an alert will be fired. Confirm that the color has changed from green to red.
 After the alert has fired, confirm an incident has been created in PagerDuty via the API. Once the module exits the critical state (recovered), it will then automatically resolve the incident within PagerDuty.
FAQ
How do alerts from Pandora FMS match with PagerDuty incidents?
Each Pandora FMS alert matches up with a PagerDuty incident; if one is not available, an incident will be created.A new incident will be created by a Pandora FMS' alert when:
- A PagerDuty incident associated with the alert cannot be found (for example, if the alert was never fired before).
- When the PagerDuty's incident associated with the alert was closed (status: Resolved). This status can be changed by:
- The user: The incident was marked closed but is still happening, so a new incident will be created and associated with the alert.
- Pandora FMS: A Pandora FMS alert is configured to close the incident when it has recovered. When it fires again, a new incident will be created and associated with the alert.
How does the perl script work?
The script is called pandorafmsalert2pagerduty.pl and has the following syntax:
/pandorafmsalert2pagerduty.pl [service_api_key] [id_alert] [event_type] [description] [fired_timestamp*] [severity*] [agent_name*] [module_name*] [module_data*]- service_api_key: The API key of the PagerDuty service where the incident will be created.
- id_alert: Identification number of the alert in Pandora FMS.
- event_type: Incident type within PagerDuty; 'trigger' to create an incident and 'resolve' to close it.
- description: Description stored in the PagerDuty incident.
- fired_timestamp: Timestamp with format 'yy-mm-dd hh:mm:ss'; when the alert was fired on Pandora FMS.
- severity: Alert severity (Maintenance, Informational, Normal, Minor, Warning, Major, Critical).
- agent_name: Name of the Pandora FMS agent that fired the alert.
- module_name: Name of the Pandora FMS monitor that fired the alert.
- module_data: Monitor data that caused the alert to be fired on Pandora FMS.
Troubleshooting
The Pandora FMS alert is fired but it doesn't create anything on PagerDuty
Possible causes:
- Misconfiguration: Be sure that your Pandora FMS command, action and template are properly configured, after following all the steps above.
- SSL dependences: The integration script makes a call to the PagerDuty API using HTTPS. For this to work, the Perl dependencies for IO::Socket::SSL must be installed first.
Incidents triggered on PagerDuty but not resolved when recovering
Possible causes:
- Misconfiguration: The Pandora FMS alert must be configured with a template where recovery is enabled and field9 is configured with 'resolve', as explained above.
- Error creating auxiliary files: The integration script maintains a list with the match up between the Pandora FMS and PagerDuty's IDs. These hidden files are created by default within the same path of the script; this path may not be writable, due to a permissions issue.
- Variables: edit the integration script and set a writable path in the variable $matchup_dir at the start of the file.
I need to debug the script execution
The alert execution debugging on Pandora FMS server is set at level 8 for verbosity. You must set at least this level in the verbosity token of the pandora_server.conf on your system (located at /etc/pandora/) and restart the server (/etc/pandora_server restart) to debug. You'll then be able to read the executing command on the pandora_server.log file (located at /var/log). From this point on, you can do tests manually on the command line from your server shell and get more feedback from your execution results.
For all other questions, please contact support.
Ready to get started?
Try any product on the Operations Cloud for free.
No credit card required.