- PagerDuty /
- Blog /
- Announcements /
- Gain Greater Context with Rich Incidents
Blog
Gain Greater Context with Rich Incidents
The site is down. Alarms are going off. Before you can fix anything, you first have to understand what’s going on. And gaining context can be hard as you look across multiple systems and metrics.
We’re pleased to announce Rich Incidents, a new feature for PagerDuty that helps incident responders get real-time data at the most critical moment in the incident lifecycle. Now, responders can go straight from an alert to a conference bridge, chat room, or runbook, giving them instantaneous access to each other and to any institutional knowledge they might need. Additionally, embedded graphs give more understanding into an incident, helping you respond faster and maintain a dependable product for your customers.
Link to Conference Calls, Blue Jeans, Hipchat, Google Hangout…
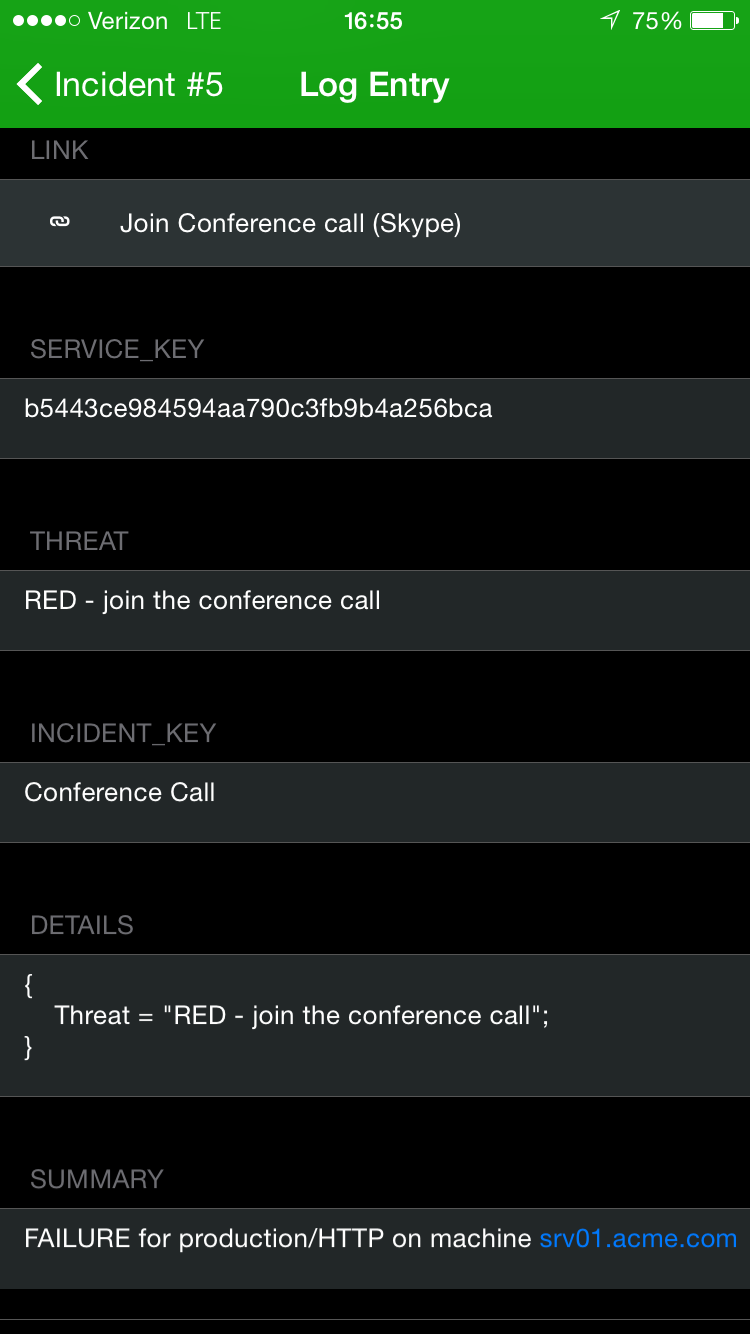
Very few major incidents are solved by one person alone, so it is helpful to have an easy way to bring together your incident response team. With our Rich Incidents update, incident responders can jump into a conference call or Hipchat room directly from an incident. Simply include a link to a conference bridge or other place where your coworkers are communicating to get you instantaneously in touch, straight from the alert.
Link to runbooks or other documentation
Runbooks and internal wikis empower your responders to tackle problems that they would otherwise have to escalate. And the fewer people have to work on an incident, the faster it can be resolved. With Rich Incidents, you can provide a link to documentation or instructions right in the alert, allowing users to get immediate insight into how they can fix the problem.
Include graphs and images in alerts
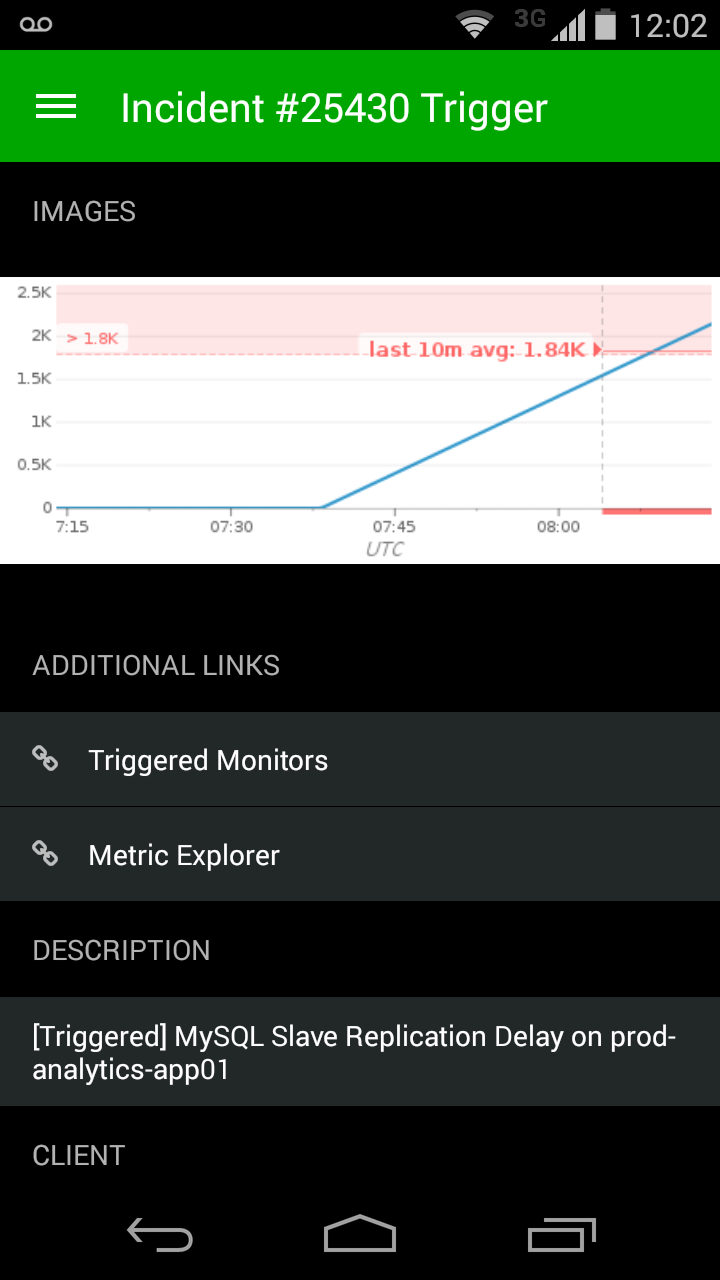
With our key partners Datadog and Ghost Inspector, you can include a graph in the alert, to share context into the history of individual metrics.. For a long time now, users have been able to display graphs in chat clients, and it’s been helpful for talking about incidents and recognizing patterns. Now you can see this information the second you open your alert
Datadog
Datadog integrates metrics and events from your servers, applications, and cloud services. They have a strong focus on discovering and sharing real-time metrics between your development and operations teams. With Rich Incidents, Datadog now includes an embedded graph of the metric that triggered the alert, which should help the responder gain relevant context to understand the severity and scope of the issue.
Ghost Inspector
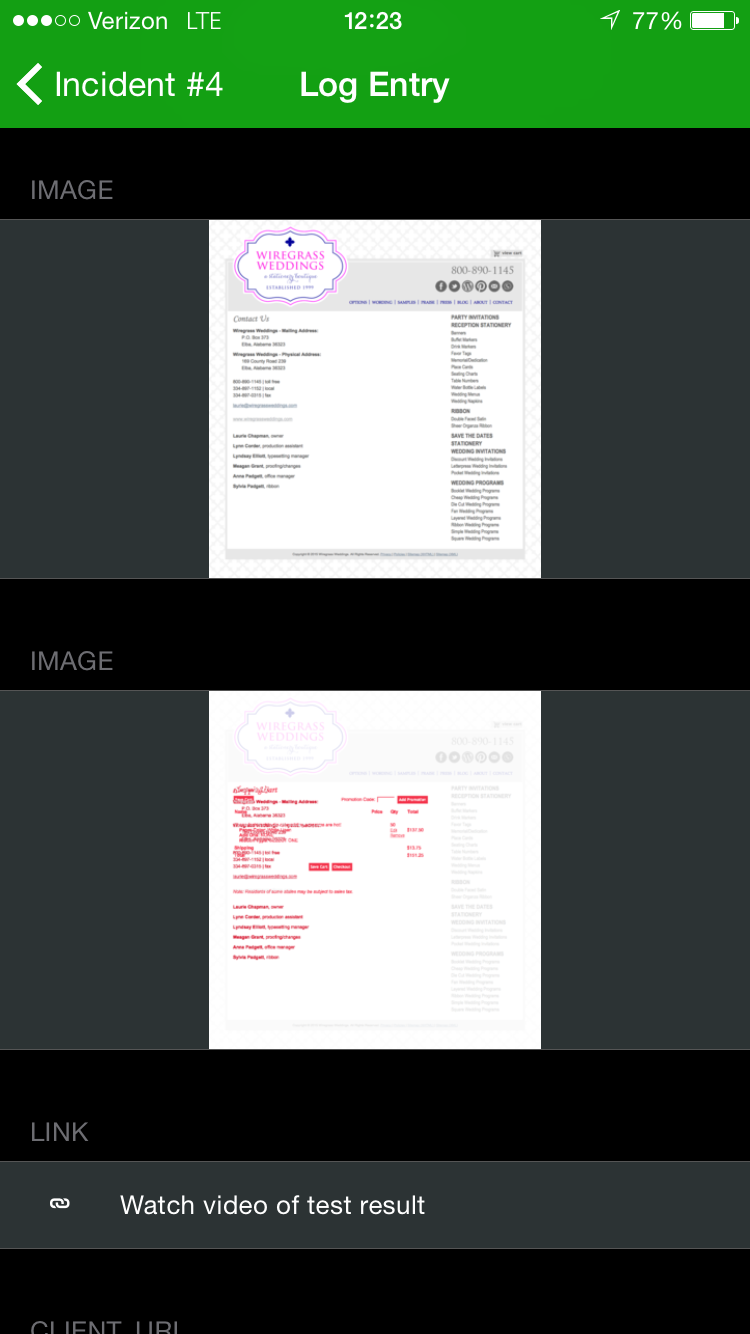
Ghost Inspector an automated browser testing service. It performs automated sequences of steps in a web browser to ensure that your website’s functionality is working properly. It triggers alerts when something breaks.
With Rich Incidents, Ghost Inspector alerts include images of the screen that the test failed on, as well as the screen that is supposed to be shown (to spot visual differences). They also include a link to the video run-through of the test, and details about the failure in the “Details” section.
Custom Graphs and Images
You can also use our API to make your own custom graphs to include in alerts. Take a look at sample code here that will let you to trigger incidents with customized data, allowing you to alert someone with a visualization of whatever you want.
Use It in Your Own Integrations
If you’d like to start sending links and images in your own integrations, check out the contexts field in our developer documentation.


