- PagerDuty /
- Blog /
- Uncategorized /
- Cool Things You Can Do with the PagerDuty API
Blog
Cool Things You Can Do with the PagerDuty API
Extend PagerDuty with our API
One of the great things about PagerDuty is our API. With our API, you can integrate with a wide variety of partners, and also extend and customize your PagerDuty experience. Our customers have done a number of cool things, including creating custom reports and dashboards, creating status pages to let customers and internal stakeholders know about incidents, and automating the details of their incident response. The PagerDuty API helps you respond to incidents more efficiently.
But where do you get started? We’ve highlighted some great add-ons below to help you make the most of PagerDuty. Some have been created by our in-house engineers, and some have come from our talented community. We publish code samples of our favorites add-ons on our tools page, so if you’ve built a PagerDuty tool, we want to know about it! Send it to developers@pagerduty.com.
Phone tools
PhoneDuty (Heroku) – Customer trust is predicated not just on how dependable your product is, but also on how quickly you are able to assist when something goes wrong. Depending on your SLA agreements, you might need an option to route live, inbound calls to an engineer or customer service representative after hours. PhoneDuty is a Twilio Twimlet that queries PagerDuty to find the currently on-call engineer and forward the inbound call to them. You will need to buy a phone number from Twilio, which will give the caller a voice prompt letting them know who is on call and what time it is in their time zone before connecting them to the rostered engineer.
PhoneDuty (Google App Engine) – Don’t want to direct live calls to your on-call engineers, but still want to provide 24/7 phone support? This script, also a Twilio Twimlet, runs on Google App Engine and forwards incoming voicemails and SMS messages to on-call engineers, who can then manage them as regular PagerDuty incidents. You can also dispatch voicemails as alerts with RingCentral, a cloud-based telephone provider that provides on-demand phone numbers and voicemail systems. Step-by-step instructions for using PagerDuty with RingCentral can be found here.
Operations tools
PDMaint – This command line utility is a python script for scheduling and managing multiple maintenance modes (for example, every Friday evening), as opposed to manually putting a service into maintenance mode. It can also be used to start a maintenance mode as part of a process. This is useful if, for instance, you have a script that you know triggers an error but have to keep it running. You could make the first line of the script disable the service to block the alerts.
Hubot-Pager-Me – Incorporate PagerDuty into your chat client! (We’re all about ChatOps around here). Hubot is a customizable chat bot. It can ship code, act as the interface to a CI server, and announce deployments, among many other things, all within a chat window. And, with this add-on, it can work with PagerDuty. It takes a little configuration, but if you follow the integration steps, PagerDuty can participate in any chatroom that Hubot supports.
Reporting tools
Graphite – This Ruby integration script collects PagerDuty incident metrics and sends them to Graphite, an open-source, scalable realtime graphing system. Users can collect numeric time-series data, send it to Graphite, and create monitors and charts to help your team visualize outage specifics.
Opsweekly – Etsy created this handy, multi-purpose tool with the premise that on-call time should be quantified. It generates a weekly report and lets on-call engineers track their notifications to assess the signal-to-noise ratio of the alerting system. Over time, your team can gather enough data to get in depth reports like, for example, what alerts wake people up the most, the average alert volume per day, and on-call improvements over the last year. Engineers can also integrate their Opsweekly to their Fitbits or Jawbone UPs to provide insight into how being on-call is affecting them. It tracks lost sleep time and Mean Time to get back to Sleep (MTTS), and provides data that could help teams determine what alerts really call for disrupting an engineer’s REM.
Zoho Reports – You can use Zoho Reports to query our API and build dashboards from the data. We recently published a post about how to import PagerDuty data into Zoho Reports and run SQL queries against it to build out your reporting features and track which services and escalation policies had unusually high (or low) incident volumes and Mean Time to Repair (MTTR).
Dashboard tools
On-Call Dashboard – Need a place to send your internal stakeholders to let them know who is on-call at any given time? This script creates a quick and simple dashboard that presents the engineers’ name, contact information, on-call schedule, and escalation policy and level.
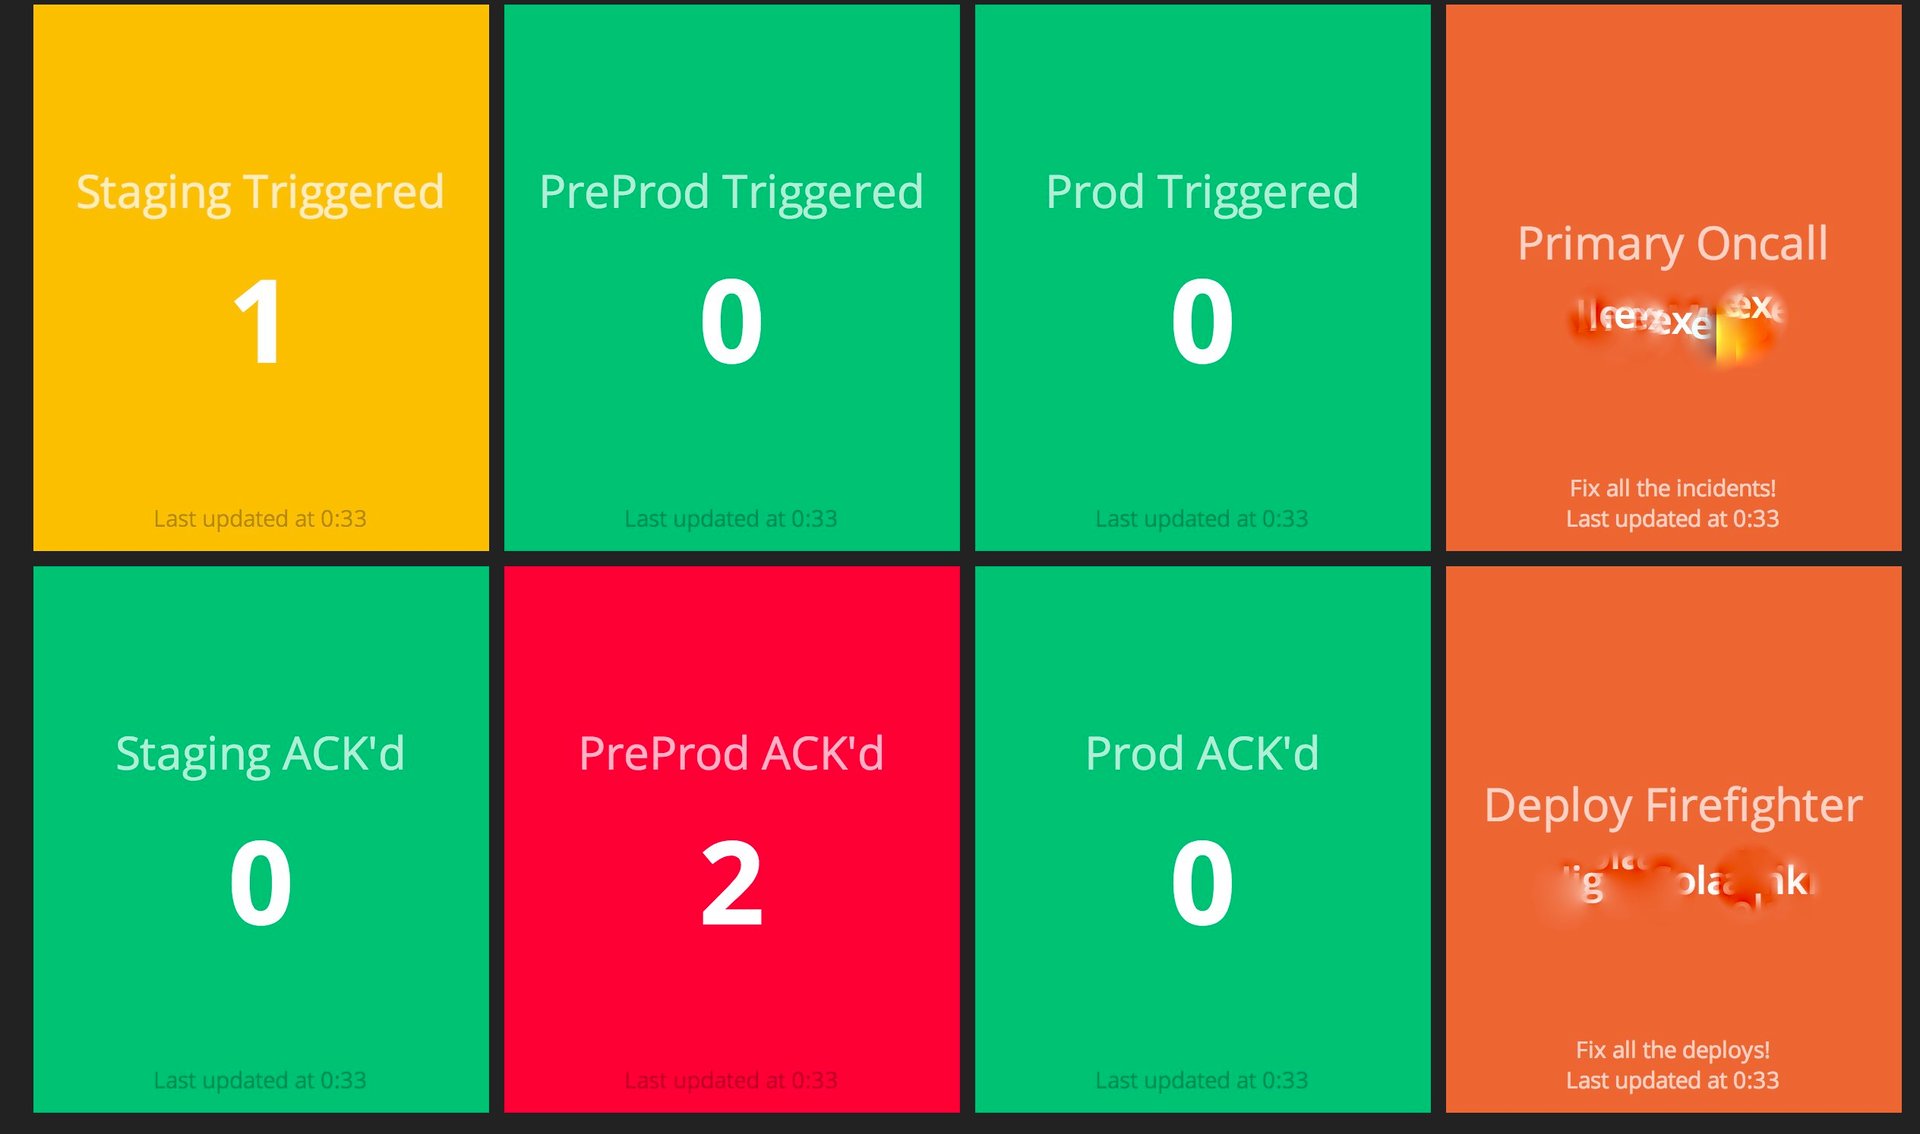
Dashing Dashboard – For the more design-minded among you, this attractive dashboard displays the number of triggered and acknowledged incidents on the dashing dashboard framework. It utilizes the hotness widget to change colors according to how many outages are occurring, and it exhibits the name of the primary “firefighter” on duty.
Fun tools
Pager Huety – This was a hack week project developed by a user that didn’t want to be jolted out of dreamland by an abrasive ringtone and preferred waking up to the warm glow of a Philip’s Hue light bulb. This script will let you follow in his footsteps by rigging a bulb to flash when open incidents are assigned to you.
Samuel L. Incident – A fun toy to pepper your incidents with the wisdom of Samuel L. Jackson. The path of the righteous man is beset on all sides by the inequities of the selfish and the tyranny of outages.


