- PagerDuty /
- Blog /
- Incident Management & Response /
- Failure Friday: How We Ensure PagerDuty is Always Reliable
Blog
Failure Friday: How We Ensure PagerDuty is Always Reliable
Ask any PagerDutonian what the most important requirement of our service is and you’ll get the same answer: Reliability. Our customers rely on us to alert them when their systems are having trouble; on time, every time, day or night.
Our code is deployed across 3 data centers and 2 cloud providers to ensure all phone, SMS, push notifications and email alerts are delivered. Critical paths in our code have backups; and then our code has backups for the backups. This triple redundancy ensures that no one ever sleeps through an alert, misses a text message or doesn’t receive an email.
We Need More Than Failure Tolerant Design
While having a failure tolerant design is great, sometimes there are implementation issues that cause these designs to not operate as intended. For example, backups that only kick in when things are breaking can hide bugs or code that works great in a test environment but fails when exposed to production load. Cloud hosting requires us to plan for our infrastructure failing at any moment.
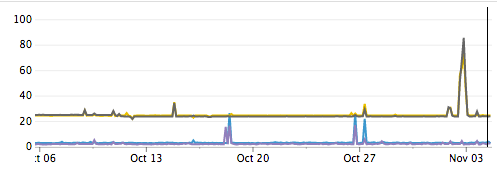
Even the Internet itself is a source of failure. We see dramatic increases in latency and packet loss between data centers on a regular basis. Some of these events can be traced back to known issues like DDoS attacks, but some causes are unknown. In either case, there isn’t anything we can do about these events other than engineer around them.
Cross Datacenter Latency in Milliseconds

Netflix has solved these problem using their Simian Army: a set of automated tools that test applications for failure resilience. Chaos Monkey shuts down instances, which are respawned via auto-scaling groups. Latency Monkey introduces artificial latency into network calls. Chaos Gorilla shuts down an entire availability zone. While some of these tools are freely available, they assume your application is deployed solely in AWS using auto-scaling groups, while ours is deployed across multiple providers.
Not wanting to get bogged down trying to produce our own equivalent tools, we decided to invest in a straight-forward method. Simply, schedule a meeting and do it manually. We use common Linux commands for all our tests making it easy to get started.
PagerDuty Failure Friday Benefits
We’ve been running Failure Friday for the last few months here at PagerDuty. Already we’ve found a number of benefits:
- Uncovers implementation issues that reduce our resiliency.
- Proactively discovers deficiencies to avoid these discrepancies becoming the root cause of a future outage.
- Builds a strong team culture by coming together as a team once a week to share knowledge. Ops can learn how the development teams debug production issues in their systems. Devs gain a better understanding of how their software is deployed. And it’s a nice perk to train new hires on how to handle outages at 11am on Friday than 3 AM on a Saturday.
- Reminds us that failure will happen. Failure is no longer considered a freak occurrence that can be ignored or explained away. All code that the engineering teams write is now tested against how it will survive during Failure Friday.
Preparing Our Team for Failure Friday
Before Failure Friday begins, it’s important that we make an agenda of all the failure we wish to introduce. We schedule a one-hour meeting and work on as many issues as we can.
Injecting failure may cause a more severe failure than we’d like so it’s important that everyone on your team buys into the idea of introducing failure in your system. To mitigate risk we make sure everyone on the team is notified and on-board.
As we prepare for the first attack, we’ll disable any cron jobs that are scheduled to run during the hour. The team whose service we’re going to attack will be readied with dashboards to monitor their systems as the failure is being injected.
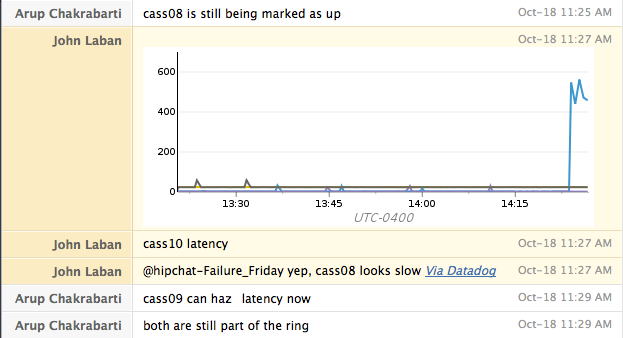
Communication is imperative during Failure Friday. At PagerDuty, we’ll use a dedicated HipChat room and a conference call so we can exchange information quickly. Having a chat room is especially useful because it gives us a timestamped log of the actions taken, which we can correlate against the metrics we capture.
We also keep our PagerDuty alerts turned on to confirm we are receiving alerts and see how quickly they arrive in relation to the failure that is introduced.
Introducing Failure to Our System
Each attack we introduce against our service lasts five minutes. Between attacks we always bring the service back to a fully functional state and confirm everything is operating correctly before moving onto the next attack.
During the attack, we check our dashboards to understand which metrics point to the issue and how that issue affects other systems. We also keep a note in our chat room of when we were paged and how helpful that page was.

For each attack, we like to first start with attacking a single host. If that attack behaves as expected, we repeat the test against an entire data center. For services hosted only on AWS, we test that a service survives losing an entire availability zone.
Attack #1: Process Failure
Our first attack is pretty simple, we stop the service for 5 minutes. This is typically just as simple as “sudo service cassandra stop.” We expect the service as a whole to continue processing traffic despite losing this capacity. We also will often find out if our alarms correctly identify this service as being unavailable. To start it again, we run “sudo service cassandra start.”
Attack #2: Reboot Hosts
Having successfully confirmed we can survive the loss of a single node and an entire data center, we move onto rebooting machines. This attack confirms that upon reboot, the machine correctly starts all required services. It also helps us find instances where our monitoring is tied to the machine running the service, so we don’t get alerted while it was shut down.
Attack #3: Network Isolation
In the previous two attacks, services were shut down cleanly, then boxes were rebooted. The next attack checks to see how resilient we are to unexpected failure. We block network connectivity via iptables. We drop both inbound and outbound packets. This test checks that clients have reasonable timeouts configured and do not rely on clean service shutdowns.
| sudo iptables -I INPUT 1 -p tcp –dport $PORT_NUM -j DROP |
| sudo iptables -I OUTPUT 1 -p tcp –sport $PORT_NUM -j DROP |
To reset the firewall after we’re done, we just reload it from disk:
| sudo rebuild-iptables |
Attack #4: Network Slowness
Our final attack tests how the service handles slowness. We simulate a slow service at the network level using tc.
| sudo tc qdisc add dev eth0 root netem delay 500ms 100ms loss 5% |
This command adds 400 – 600 milliseconds of delay to all network traffic. There’s also a 5% packet loss for good measure. With this failure, we usually expect some performance degradation. Ideally, clients can route around the delay. A Cassandra client, for example, might choose to communicate with the faster nodes and avoid sending traffic to the impaired node. This attack will test to see how well our dashboards identify the slow node. Keep in mind that this also impacts any live SSH sessions.
The delay is easily reverted.
| sudo tc qdisc del dev eth0 root netem |
Wrapping Things Up
Once we’re done with Failure Friday, we post an all clear message and re-enable our cron jobs. Our final step is to take any actionable learnings and assign them to one of our team members in JIRA.
Failure Friday lets us go beyond fixing problems and helps us to prevent them from occurring. PagerDuty’s reliability is extremely important to us and having our team participate in Failure Friday is how we maintain it.
Want to learn more? You can check out, Doug Barth giving a talk about Failure Friday filmed right here at PagerDuty HQ!
4 Years On
Be sure to check out our follow up blog post: “Failure Fridays: 4 Years On” to see how our process has evolved over the years.


