Monitoring in the World of DevOps
What is DevOps Monitoring?
DevOps has completely changed the game when it comes to how development and IT operations teams work and collaborate together. With clearly defined roles and shared responsibility of the products and services being deployed, DevOps helped to break down a traditionally siloed working environment while creating streamlined workflows to ensure faster production and delivery times. The goal of DevOps was to focus on the importance of workflows, integrating automation where possible in order to increase efficiency and improve productivity.
Faster, more agile systems of monitoring were required to keep up with the changes brought on by DevOps. DevOps monitoring is a form of proactive monitoring with a focus on quality early in the production lifecycle, rather than a reactive approach. DevOps monitoring emphasizes deploying reliable services and new features or updates quickly by testing earlier, often in a production environment. This meant teams were able to release updates and new features more frequently and with improved quality and less cost. It is designed to simulate real-life user interactions with your service – whether it’s an application, website, API, etc.
DevOps Monitoring Tools
DevOps monitoring tools are essential for tracking the specific data and information that is important to your company.
Some of our favorite DevOps monitoring tools include:
- For Overall DevOps Monitoring Strategy: Nagios
- For Applications Monitoring: New Relic, DynaTrace, AppDynamic
- For Infrastructure Monitoring: DataDog, LogicMonitor, SignalFX, Zenoss
- For Monitoring Logs: Splunk, LogEntries, Loggly
Choosing the right set of tools will help give you the best overview of your DevOps system in order to track key metrics such as availability, CPU and disk usage, response times, and more.
Central to the idea of DevOps is collaboration between all of the teams involved in IT applications and infrastructure. Developers, Operations, Quality Assurance, Security, and more, all have stakes in the delivery of a product or service. So, what does collaboration mean when it comes to monitoring in the world of DevOps?
How DevOps Changes The Game
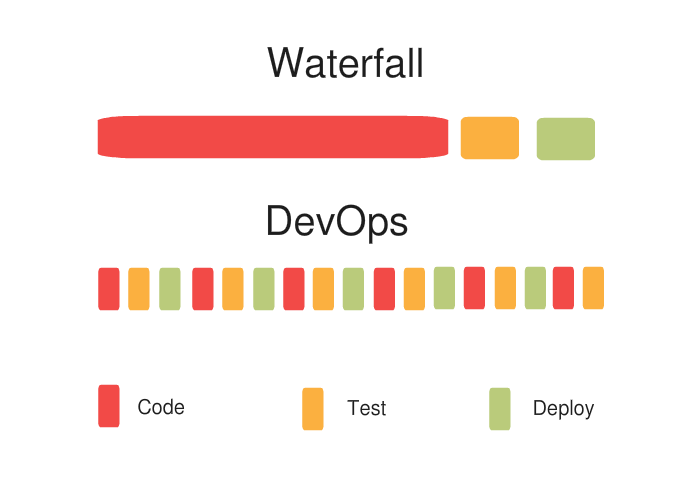
In the past, different teams involved in creating or maintaining an application would first finish their portion completely before passing it on to the next team. For example, the Development team would first write code for the entire app, or specific features in the app, before passing it to the Quality Assurance (QA) team. The QA team would then do their testing and analysis before sending it forward to Operations, and so on.
This is similar to an Olympic relay team where each person runs 100 meters before passing the baton on to the next runner. Now, think of a team using DevOps ideas as all of those runners running simultaneously, in four 100 meter sprints instead of one 400 meter sprint. Instead of waiting for one team to hand off work to the next, each is working concurrently on the application in their own area of focus. The DevOps runners have more opportunities to adjust strategy, and iteratively improve.
Cross-Platform and Cloud-Based Agility
DevOps concepts are commonly referenced alongside other software development practices such as Agile. The ideas behind Agile and DevOps are similar — break down work into smaller increments, iteratively improve in each increment, eliminate toil where it makes sense, and share learnings across the organization.
Of course, too many opinions can lead to its own set of problems. Well architected applications tend to have multiple components and clearly defined areas of concern. This is where distributed architectures such as microservices often come into the picture. This is also why teams that adopt the DevOps methodology produce a lot more releases, as they can address issues more quickly.

The Importance Of Workflows
Two minds are better than one and a dozen minds are even better. Transparency and end-to-end visibility are key factors within DevOps for good communication. End-to-end visibility means having everyone on the same page through the entire development process. When everyone is on the same page, the development process becomes a lot smoother, and there are fewer chances of having to redo things.
Faster Iterations Make For Happier Users
What’s important to remember among all the mayhem that goes into building an application is that the ultimate goal is to refine and enhance the end-user experience. Since most cloud-based applications need to react swiftly to changing user needs and market shifts, sometimes it is necessary to quickly release updates for these applications. Software developers using DevOps ideas are able to keep up with this requirement easier, as there are fewer bottlenecks in the cross-team workflow.
Apart from the fact that this makes for happy customers, it also makes for happy developers who are much less likely to lose sleep over any bugs, crashes or mishaps. With good communication as a key difference between the traditional waterfall style of development and DevOps methods, this also influences the needs of the tools.
The DevOps style of monitoring, then, is by no means easier than the traditional Waterfall method where teams often just needed a couple of tools for the entire process and a lot of humans to make up the difference. Having a single team work across a wide variety of areas (development, QA, operations, and so on) requires numerous tools that need to work well with each other. Finding a group of tools that are all compatible can be challenging, but the results are well worth it.
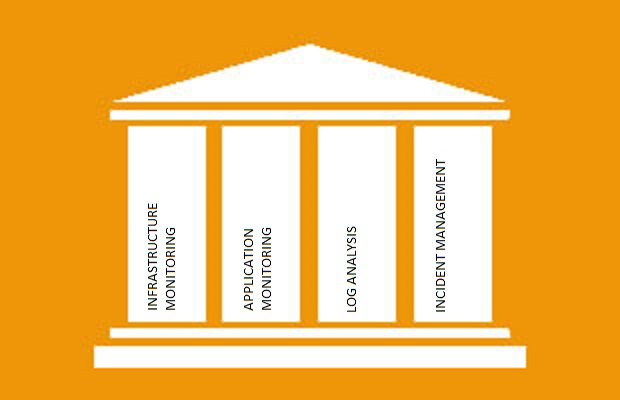
One way to consider these tools is to split them into four groups of software—Application Performance monitoring, Infrastructure monitoring, Log analysis, and last but not least, Incident Management.
 Monitoring Your Applications
Monitoring applications is a key factor in identifying issues (performance, regression, or otherwise) and fixing them quickly as part of a team’s iteration. Three of the more popular application performance monitoring (APM) tools are New Relic, Dynatrace, and AppDynamics. Apart from letting teams monitor and manage their software, they also allow for end-user monitoring, which is crucial to ensuring an application is delivering the best experience.
Monitoring Your Infrastructure
The other side of the coin to application performance monitoring is infrastructure monitoring. There are many, many tools for this, including SaaS solutions such as DataDog, LogicMonitor, and SignalFx, as well as hybrid solutions such as Zenoss. Though it’s a favorite of teams transitioning from legacy development processes, Nagios alone isn’t enough for your DevOps monitoring strategy.
Monitoring Your Logs
Analyzing logs is a crucial part of the iterative improvement cycle and is a critical part of system troubleshooting, debugging, and security incident response. Popular log analysis tools include Splunk, LogEntries, and Loggly. They allow you to study user behavior based on log file analysis. They also let you collect a fast amount of data from various sources in one centralized log stream. This is a convenient way to maintain and analyze log files. Apart from debugging, Log analysis plays a key role in helping you comply with security policies, and regulations and is vital in the process of auditing and inspection.
Quick And Efficient Incident Management
DevOps really outshines the traditional Waterfall approach in the field of incident management. It is with the help of incident management platforms like PagerDuty that cloud-based applications can now encourage users to resolve most of their issues themselves. PagerDuty is unique in its capabilities as it not only allows you to integrate with just about any tool you can imagine, it allows you to customize your incident management workflows to suit different teams. This approach avoids bottlenecks, and helps achieve the ultimate goal of providing the best user experience.
Enhancing the End User Experience
Following DevOps practices makes applications more resilient as it makes it easier to uncover implementation issues, and discover deficiencies. With infrastructure monitoring tools, a sudden influx of users that would normally crash a system can easily be detected, with application monitoring tools engineers can dive into the specifics of how performance is being impacted, and any issues that have escaped through all the different levels of quality and monitoring often require closer inspection through log analysis tooling. All the while, these tools all tie into an incident management platform like PagerDuty, to quickly enable engineers to triage and collaborate on incidents
As far as enhancing the user experience goes, DevOps is light years ahead of the traditional waterfall method and those looking to keep up with the pace of technology will have to adopt at least some aspects of this approach. Users of applications that are built and monitored by teams that use DevOps methodologies are accustomed to having their problems solved quickly and efficiently. These same users will seldom tolerate long wait times to fix bugs and catastrophes like system crashes, and anyone who wants to make an impact on this market will have to step up their game or be left behind.


