- PagerDuty /
- Blog /
- Announcements /
- Focus Response on What Matters
Blog
Focus Response on What Matters
Monitoring IT systems and applications is a complex science, and at PagerDuty, we are proud to integrate with over 175 different ITOps, DevOps, and ChatOps tools that can detect problems and exceptions in applications and infrastructure.
However, even with sophisticated processing at the source, monitoring data can be noisy, redundant, or non-actionable. Although many tools have features for reducing duplicate alerts or flapping, it’s still hard for the monitoring tools themselves to determine what needs immediate human attention and what doesn’t. Adjusting thresholds or setting up maintenance mode at the source can be an arduous and manual process, and forces teams to look to multiple sources of truth to see all their data.
At the same time, operations teams perform best when they can see all their data in a single pane of glass. Low-priority alerts and events often serve as leading indicators of simmering problems and are useful for postmortem forensics and spotting patterns at time scales of days, weeks, or months.
Suppression
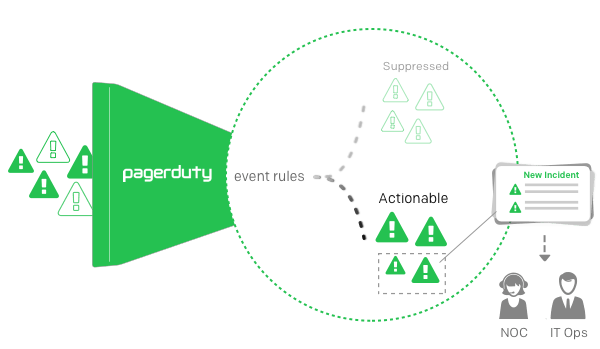
That’s why we’re proud to introduce PagerDuty’s new Suppression capability. With suppression, you can send all of your operations data to PagerDuty and only trigger incident response for immediately actionable items. Suppression helps fight alert fatigue, control complex event streams, and gives teams a single source of truth by providing all their operations data in a centralized location.
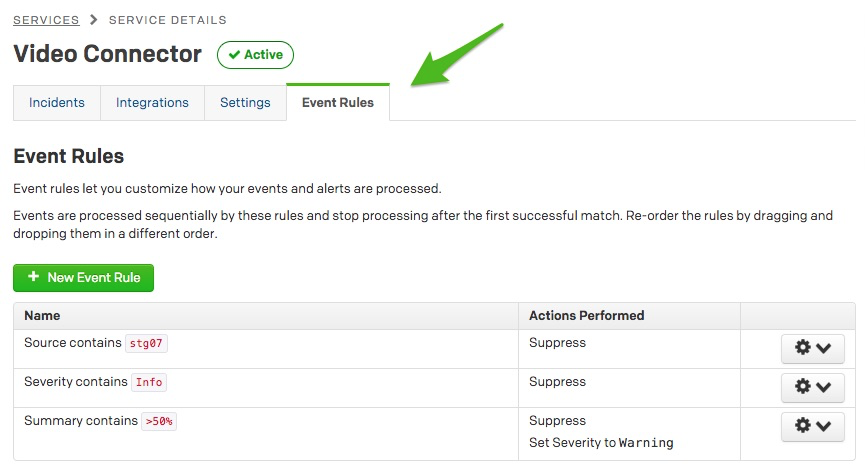
 To activate Suppression, you’ll need to set up Event Rules. Event Rules let you dynamically parse the content of incoming events and choose whether or not they should trigger incident creation. Learn how to do this on our Knowledge Base.
You can find Event Rules on any service using API-type integrations and our new Alerts and Incidents data model. Using our new PagerDuty Common Event Format, customers can apply the same rule across any API integration on the service, rather than having to remember each monitoring tool’s data schema. You can match events using a simple “Contains” statement, as well as regular expressions or looking for the existence of a specific field.

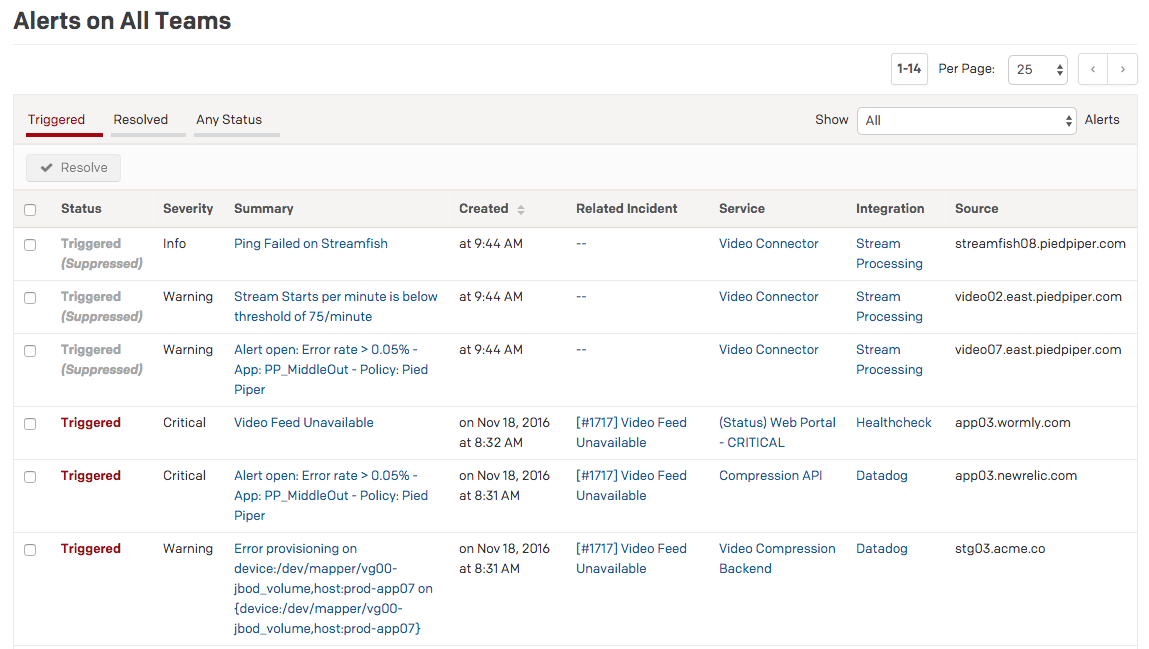
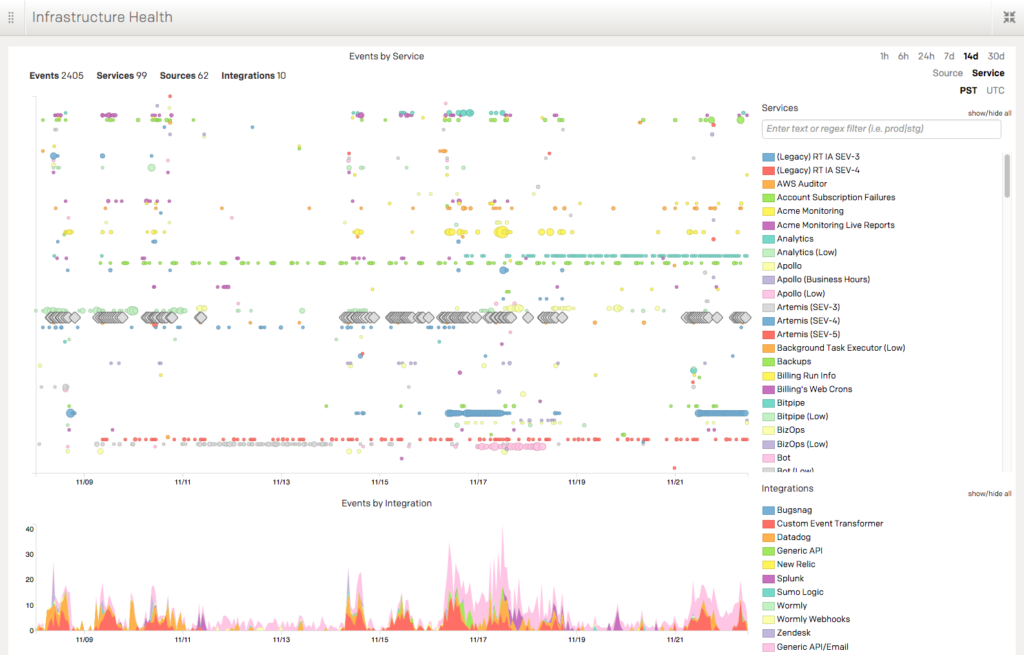
You can find suppressed alerts in the new Alerts list, as well as visualize and analyze them in the all-new Infrastructure Health Application. Powered by our new alert and incident data model, these features greatly improve responders’ and managers’ ability to focus on the right data at the right time, proactively identifying patterns in events, and continuously improving their operations performance. You can send more data into PagerDuty, be notified less, and see leading-edge indicators of problems and cascading service failures to fix problems before they become emergencies.


Suppression is available to all Standard and Enterprise customers, to help you and your team gain greater control over your operations data.
We’d love to hear what you think of this feature. You can find a complete guide to setting this feature up in our knowledge base. Please email us at support@pagerduty.com with any questions or suggestions you have for us about this feature.

